


When we talk about crypto markets, one thing becomes obvious pretty quickly: altcoins may be growing fast, but Bitcoin still runs the show. Yet if you’ve been trading or even casually watching the charts, you’ll notice something fascinating, altcoins often follow Bitcoin’s lead, but sometimes they break away and carve out their own stories. That push-and-pull is what makes market correlation such an important metric. It tells us not just where Bitcoin is heading, but how the rest of the market might react.
In this post, I’ll walk you through the key correlation metrics I use to make sense of Bitcoin’s relationship with altcoins. From Bitcoin dominance to correlation coefficients, from stablecoin liquidity flows to those exciting moments when altcoins break free, you’ll see why these metrics matter and how they can help you anticipate market moves.
1. Bitcoin Dominance: The First Correlation Metric for Altcoins
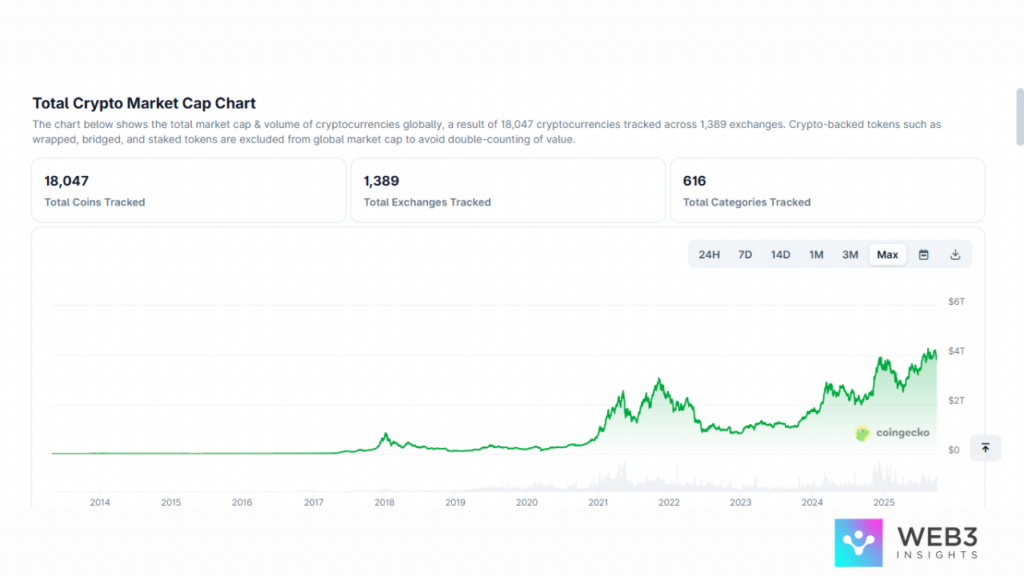
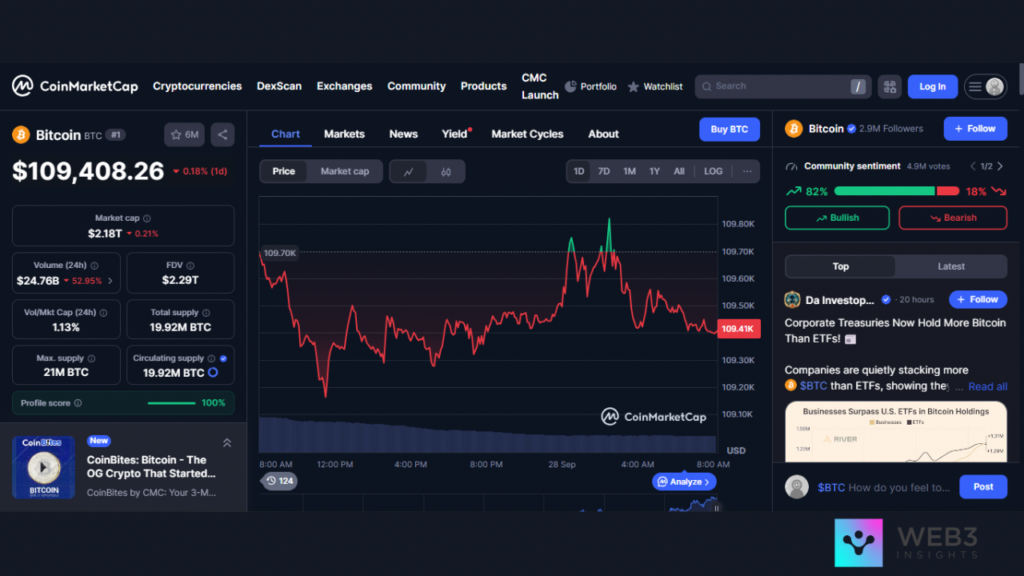
Whenever I’m analyzing the market, the first chart I open is the Bitcoin Dominance Chart. It measures Bitcoin’s share of the total cryptocurrency market cap.
Why is this important? Because when dominance is rising, it usually means traders are piling into Bitcoin for safety, pulling money out of altcoins. On the other hand, when dominance falls, it suggests confidence is spilling over into altcoins, and that’s when you often see those explosive “alt seasons.”
For example, in early 2025, Bitcoin’s dominance hovered around 50–52%. Each time it pulled back a little, coins like Solana, XRP, and TRON enjoyed sudden bursts of trading activity. It’s a simple metric, but it sets the foundation for understanding the broader relationship between Bitcoin and altcoins.
2. Correlation Coefficients: Measuring How Altcoins Move With Bitcoin
Beyond dominance, I like to look at correlation coefficients. These are numbers between -1 and +1 that measure how closely two assets move together.
- A correlation near +1 means the altcoin moves almost lockstep with Bitcoin.
- Around 0 means little or no relationship.
- Near -1 means the altcoin often moves in the opposite direction.
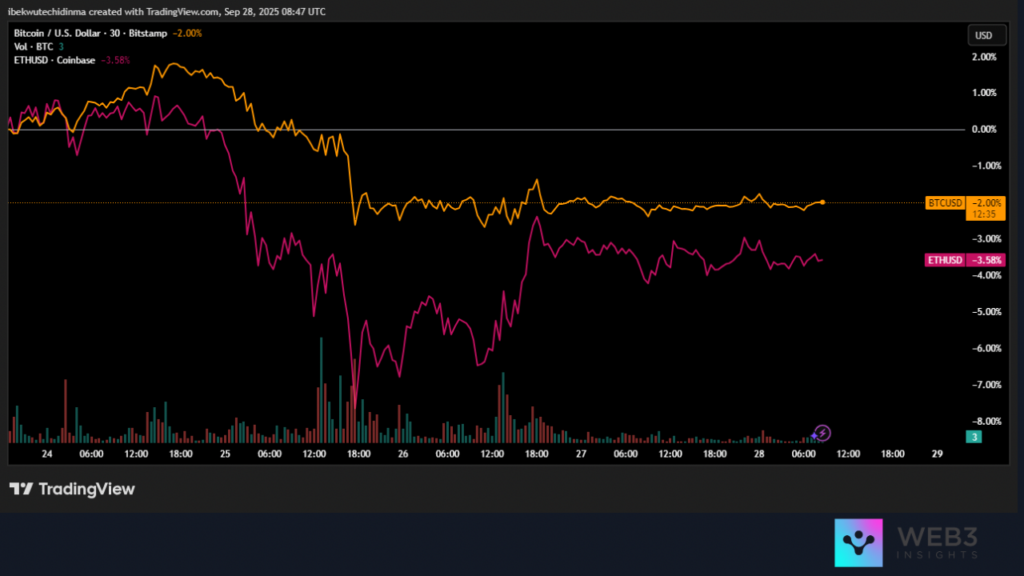
ETH, for example, usually shows a strong positive correlation with BTC (often above 0.8). But coins like Monero or Dogecoin sometimes drift lower, showing they have minds of their own. That’s valuable knowledge: if you’re holding Bitcoin, you can predict ETH’s movement fairly easily. But if you want exposure that’s less tied to Bitcoin, you look for coins with weaker correlations.
3. Altcoin Breakouts: When Correlation Weakens
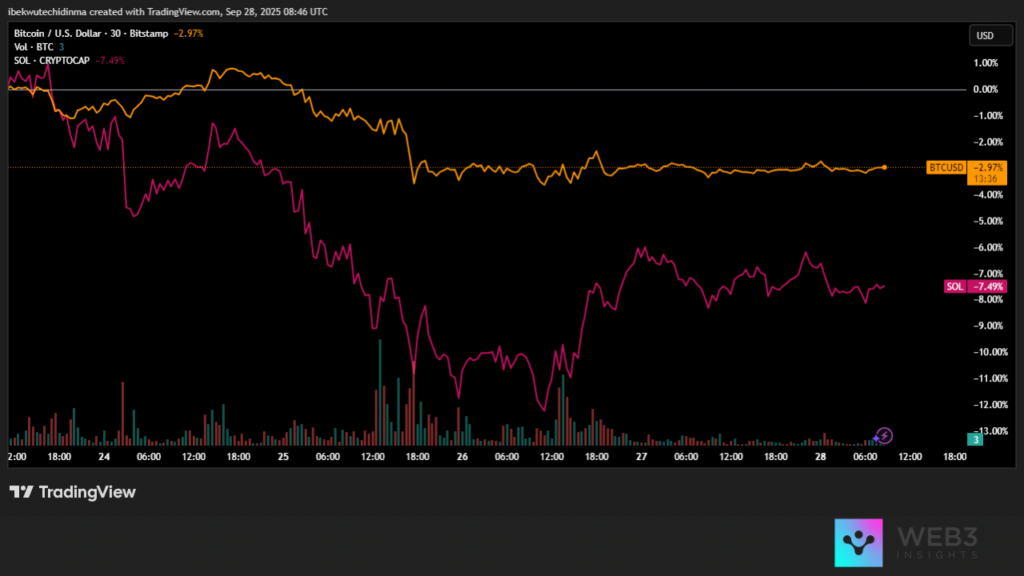
Some of the most exciting moments in crypto come when altcoins decouple from Bitcoin’s trend. Imagine BTC moving sideways for weeks while Solana suddenly rockets 40% thanks to a network upgrade or a surge in DeFi activity. That’s correlation breaking down in real time.
In 2025, we’ve already seen this a few times: Solana rallying hard despite Bitcoin’s consolidation, or XRP surging on legal clarity while Bitcoin stayed flat. These events remind me why it’s not enough to only follow Bitcoin, altcoin-specific catalysts matter just as much.
For traders, spotting these moments early can be gold. A weakening correlation can mean an altcoin is about to break away and set its own pace.
4. Stablecoins and Altcoins: Hidden Correlation Through Liquidity
It’s not just Bitcoin pulling the strings, stablecoins like USDT and USDC are crucial liquidity bridges. They sit at the heart of almost every altcoin market. If USDT volumes spike, it often signals heavy trading in altcoins.
This creates a hidden form of correlation: Bitcoin may not move much, but when stablecoin flows ramp up, altcoins can surge. DeFi protocols rely on stablecoin liquidity, and NFT marketplaces settle trades in them too.
I always keep an eye on stablecoin trading pairs. If I see ETH/USDT or SOL/USDT trading volumes suddenly dwarfing BTC/USDT, I know altcoins are in play.
5. Why Correlation Metrics Matter for Traders
So why does all of this matter? Because correlation metrics help you time your rotations.
If Bitcoin dominance is climbing, I know it’s safer to hold BTC or stablecoins. If dominance is falling and correlation with altcoins remains high, I’ll consider shifting into ETH, SOL, or other large-cap altcoins. And if I see correlations weakening while altcoin volumes are spiking, that’s when I hunt for breakout trades.
At the end of the day, Bitcoin sets the tone, but altcoins write their own stories when metrics start to diverge. Knowing how to read correlation helps me stay one step ahead instead of chasing the crowd.
Final Thoughts
Altcoins and Bitcoin are like dance partners. Most of the time, they move in sync, with Bitcoin leading the steps. But every so often, altcoins spin away, powered by their own narratives, a new DeFi trend, a stablecoin liquidity surge, or just sheer retail momentum.
The key is watching the metrics: dominance, correlation coefficients, breakout patterns, and stablecoin flows. These numbers tell a story long before price alone does. For me, they’re not just charts, they’re a way to understand the market’s heartbeat.
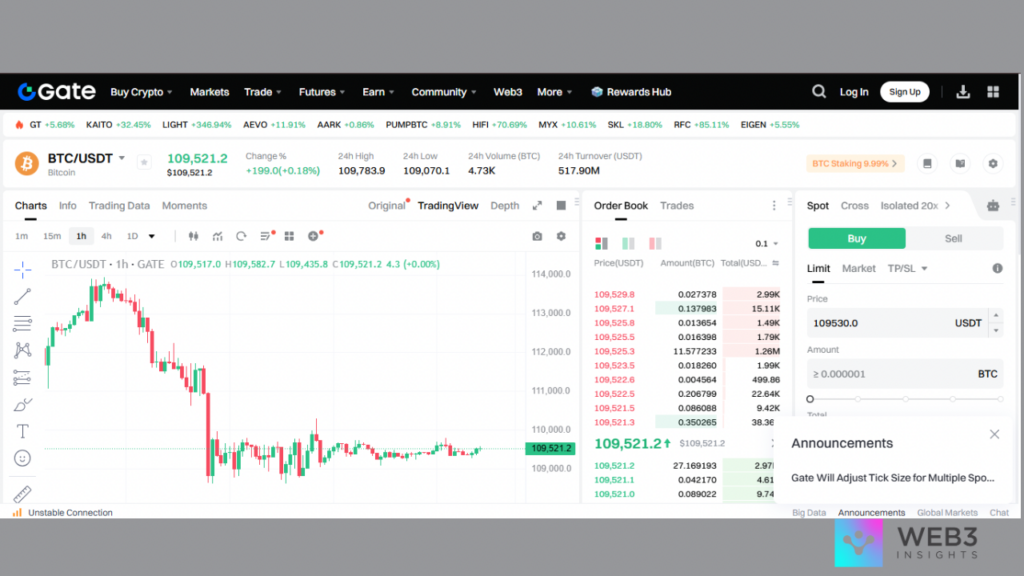
So next time you open your trading dashboard, don’t just look at Bitcoin’s price. Ask yourself: How are the altcoins moving in relation? Because that’s where the real opportunities often hide.