


When I track altcoins, I’ve noticed something interesting: they don’t just tell us about trading, they also give hints about NFT adoption. Most people think you need to dig directly into NFT marketplaces to understand growth, but altcoin metrics often reveal the story earlier.
I still remember the first time this hit me. Back in the middle of an NFT mint on Solana, I wasn’t even looking at the NFT chart itself. Instead, I saw Solana’s trading volume spike like crazy, and only afterward did I realize it was tied to a wave of people buying NFTs. That was when it clicked: if I wanted to understand NFTs before the headlines, I had to start looking at altcoins first.
Why Altcoins Are Key to Tracking NFT Adoption
NFTs don’t exist in isolation. Every mint, every trade, and every marketplace interaction happens on an altcoin network. Whether it’s Ethereum with its blue-chip collections, or Solana powering fast-moving communities like Mad Lads, the point is the same: NFT activity is anchored in altcoin blockchains.
That means when Ethereum is buzzing, its gas fees spike, wallet activity surges, and ETH itself moves differently than the broader market. We saw this back in the 2021 NFT boom, where ETH’s rise lined up with OpenSea hitting record volumes. A few years later, Solana carved out its place in the NFT space, and every cycle since then, SOL metrics have mirrored NFT hype almost perfectly.
Altcoins like SOL, IMX, and APT are now deeply tied to the NFT narrative. Watching their movements gives me an edge. Instead of waiting for marketplace reports, I look at altcoin metrics first. They’re faster, more transparent, and often more predictive.
Metric 1: Trading Volume on NFT Altcoins
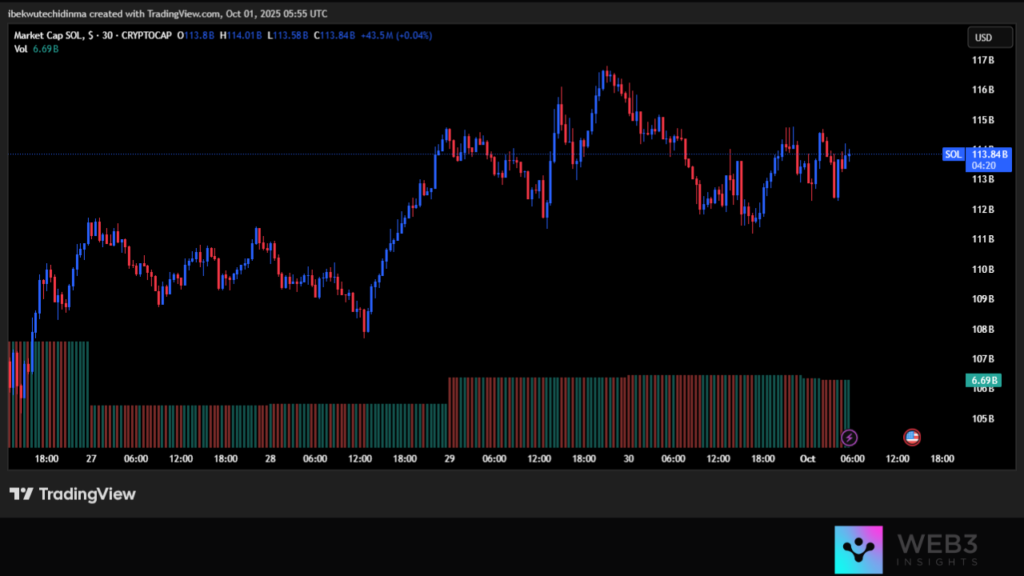
The first thing I check when I’m gauging NFT adoption is trading volume on NFT-heavy altcoins. If SOL or IMX is seeing unusual spikes in daily volume, I take that as a red flag to pay attention.
For example, earlier in 2025, Solana’s trading volume jumped by nearly 60% in a single week. This wasn’t a random move, it was directly tied to the launch of Mad Lads Season 2, one of the most hyped NFT mints on the network. Without even opening an NFT tracker, I could already see adoption brewing.
The same goes for Immutable X (IMX). Since IMX is laser-focused on gaming NFTs, any sharp uptick in volume usually signals a hot new game launch or mint. By simply watching these altcoin charts, I get a strong early read on what’s happening in NFTs.
Metric 2: On-Chain Activity & Transactions
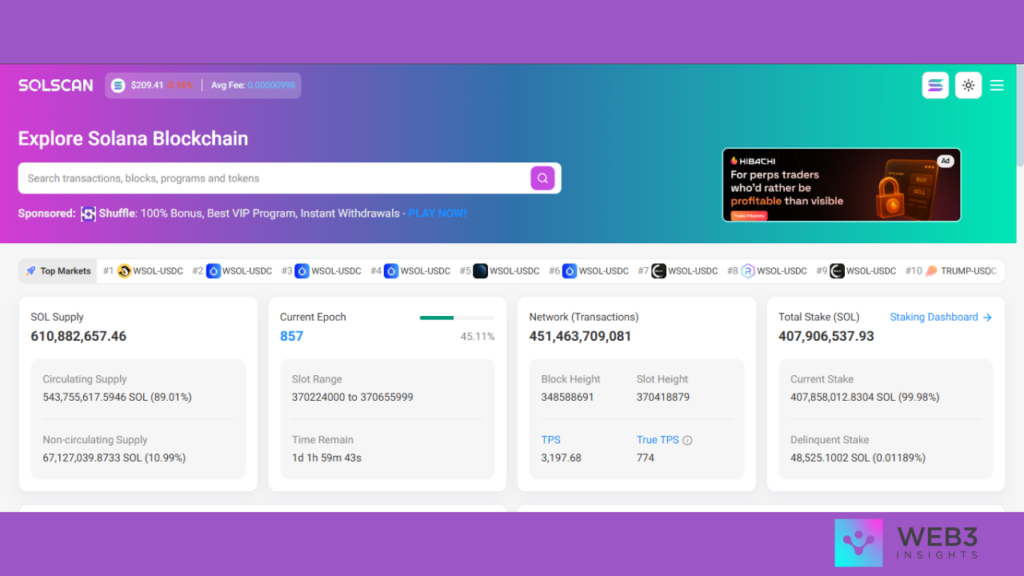
Price and volume only tell half the story. To really understand NFT adoption, I also look at on-chain activity, specifically wallet transactions. If a chain like Solana or Ethereum is seeing surges in daily active addresses, that usually means NFT users are piling in.
What I like about this metric is that it cuts through speculation. Altcoins can pump on pure hype, but if I see wallet activity climbing alongside it, I know it’s has a link to genuine usage. For example, during NFT mint waves, Solana often shows a sharp increase in unique wallets, and you can tell the difference between bot-driven mints and real user adoption (more diverse, higher-value transfers).
Tools like Artemis, Dune Analytics, and Solana Explorer make this easy. I can quickly pull daily active wallet stats, and if I notice a sustained rise, I take it as a reliable sign that NFTs are attracting more users.
Metric 3: Stablecoin Flows into NFT Altcoins
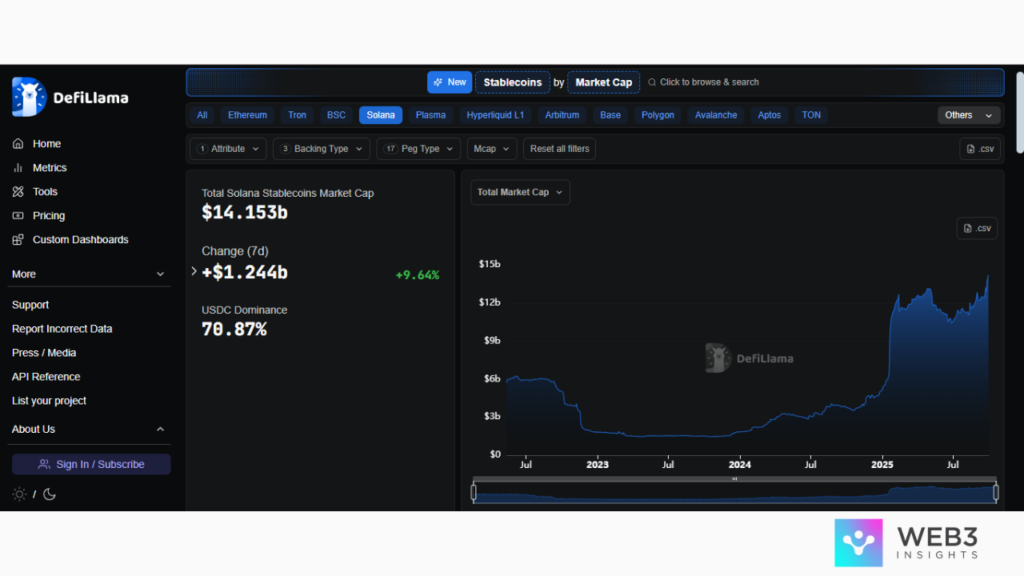
Here’s where things get even more interesting. Before anyone mints an NFT, they usually need to move stablecoins into NFT-heavy altcoins. Think of it as fueling up before a road trip. If I see USDC flowing heavily into Solana or Immutable, it tells me liquidity is about to hit NFT markets.
What’s even more fascinating is how different stablecoins play different roles. USDC is the favorite on Solana, while USDT dominates on TRON. And since Solana is a hub for NFT trading, rising USDC inflows often line up with upcoming mint hype.
DefiLlama is a great place to watch these stablecoin flows. It’s almost like having an early warning system: before NFT volumes explode, liquidity first shows up in stablecoin charts. By tracking this movement, I can anticipate adoption waves before they hit.
Metric 4: NFT Marketplace Token Performance
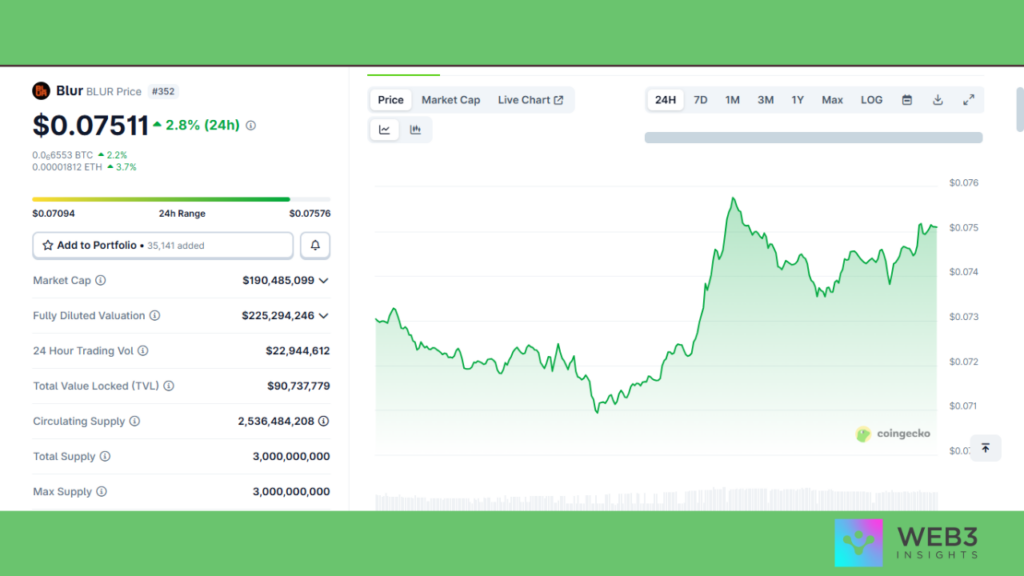
Another piece of the puzzle comes from NFT marketplace tokens. Projects like Blur (BLUR), LooksRare (LOOKS), and X2Y2 all issue their own tokens, and the performance of these tokens often mirrors overall marketplace activity.
For example, when BLUR ran its airdrop campaigns and incentives, not only did marketplace volume skyrocket, but BLUR’s token also surged. Watching BLUR’s price gave me a direct sense of how much adoption was happening across the ecosystem.
These tokens aren’t perfect indicators, tokenomics and speculations influence them, but paired with on-chain activity, they give another angle into NFT adoption. If BLUR is moving up while active wallets and trading volumes rise, that’s a powerful confirmation signal.
Conclusion
Measuring NFT adoption doesn’t have to be hard. By keeping an eye on altcoins, you can track adoption through trading volume spikes, stablecoin inflows, and marketplace token performance. Together, these metrics paint a clear picture of how the NFT ecosystem is evolving, without relying only on NFT marketplaces themselves.
For me, this approach has been a game-changer. Instead of just reacting to NFT headlines, I can anticipate trends early by watching altcoin behavior. If you’re serious about spotting the next wave of NFT adoption, start with the metrics, because altcoins will tell the story first.